Editor’s Note: This blog post is in response to a column appearing in the LA Times titled “How Mississippi gamed its national reading test scores to produce ‘miracle gains.‘” We’re not going to link to it because we don’t believe it is worth your clicks; however, feel free to google.
***

By Rachel Canter I Executive Director
This morning, I was contacted by a long-time national educator reporter for my thoughts about a column that appeared in the LA Times purporting to “debunk” Mississippi’s NAEP gains. What appears below is a slightly edited version of my response. It is based on what I’ve been telling reporters and other education colleagues for over three years and features some very ugly hand-written notes I took on NAEP print-outs in December 2019. I was also interviewed by Bellwether about this topic in 2020 and gave a shortened version of this explanation; read that response here. I talk about NAEP scale points in this post, but one should note that not all scale points are equal due to the rules of statistical significance, so the notes below are important. The NAEP website also has multiple tools to examine whether a scale point change between two given years is statistically significant, and I would encourage readers to look at that site as well.
Mississippi’s Actual NAEP Scores
Let’s start this post by exploring Mississippi’s actual NAEP data and how it has changed in the last two decades. This is important because the story of Mississippi’s progress does not begin in 2019, 2015, or even 2013—we’ve actually been on a 20-year journey to “miracle” status.
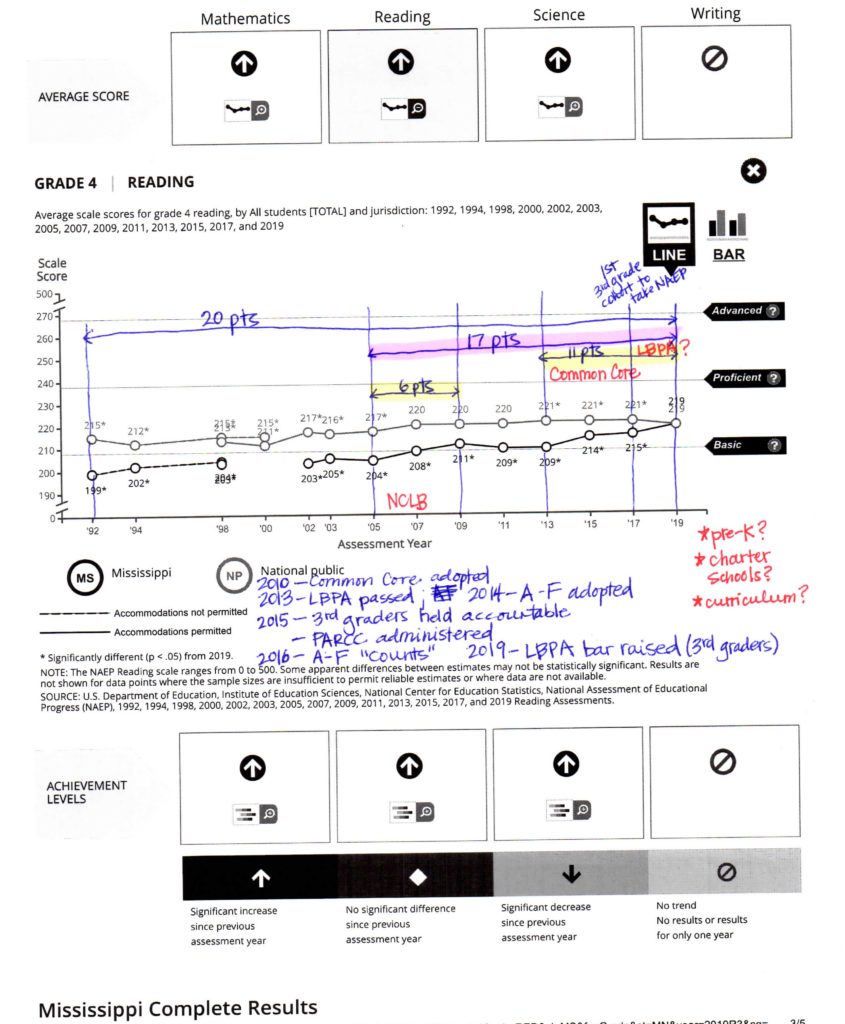
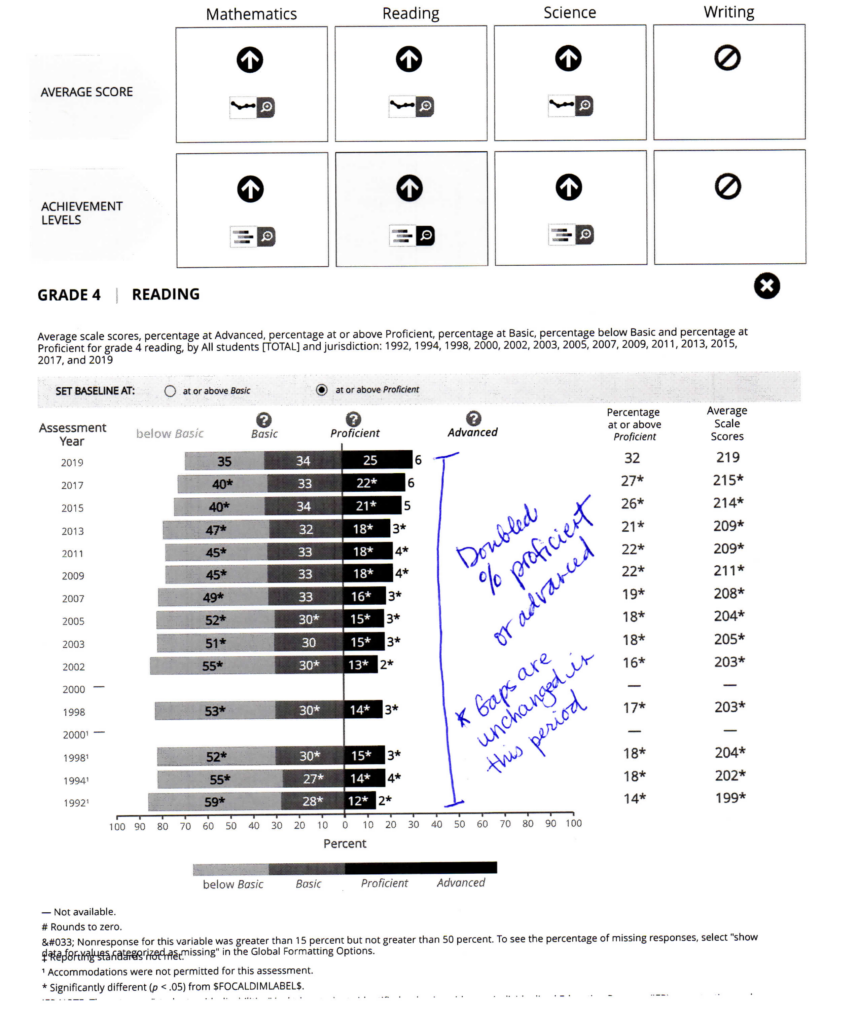
On the 4th grade reading test, Mississippi gained 20 scale points between 1992, when the first state NAEP data were released, and 2019, when we first reached the national average. The majority of these gains happened between 2005 and 2019, a time in which the nation was mostly stagnant in its 4th grade reading scores (though it did improve slightly). Mississippi had two periods of big gains: 2005-2009 and 2013-2019 (over half of the gains in this second time period are between 2013-2017). See the ugly print-outs below that you can reproduce on NAEP’s website.
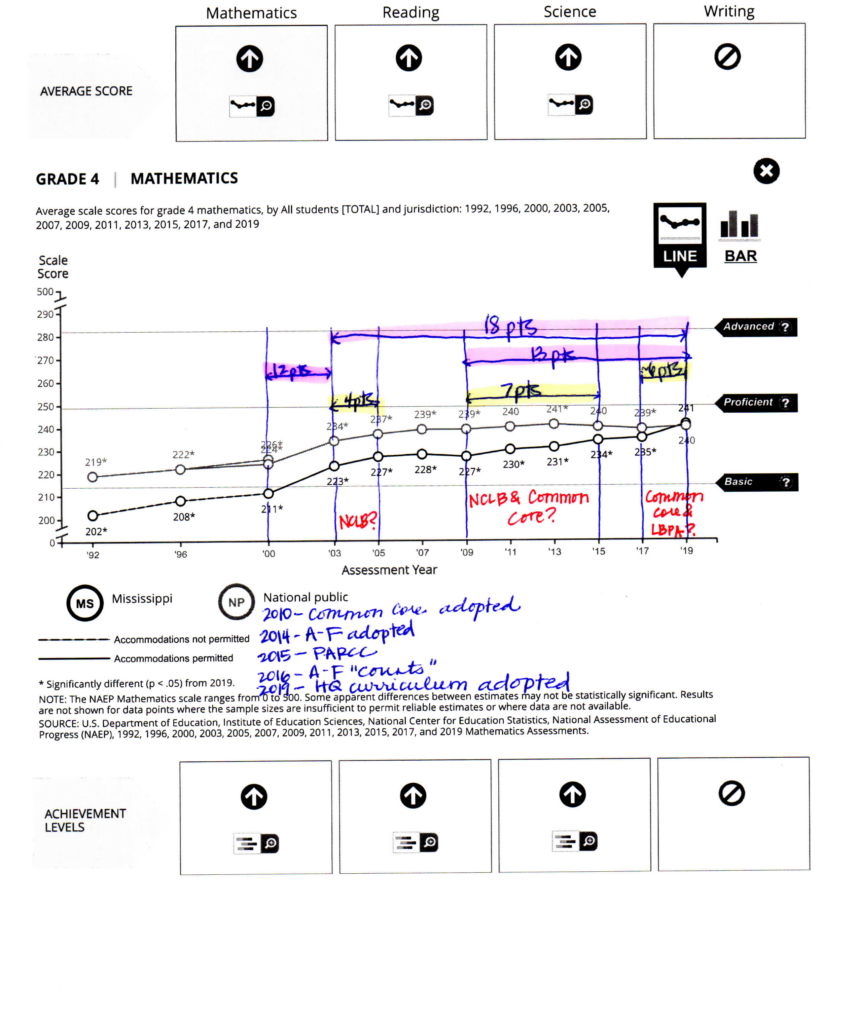
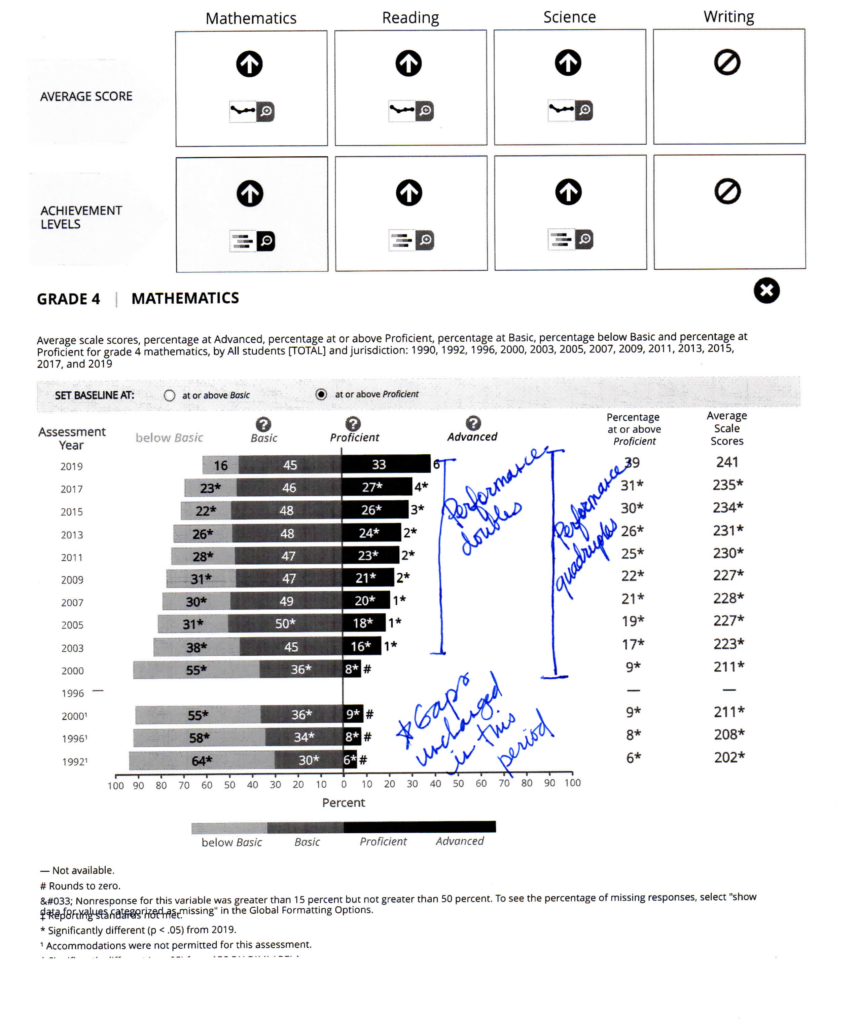
On the 4th grade math assessment, we gained 18 points from 2003 to 2019.1 Mississippi’s math gains were very steady in this 16-year period, with the state improving little by little while the nation stood still, until we finally saw Mississippi’s gap-closing jump between 2017 and 2019.
When Did the Literacy-Based Promotion Act Affect 4th Graders?
Mississippi’s Literacy-Based Promotion Act (LBPA) did not pass until spring 2013 and the “gate” (i.e., the requirement that students score a minimum level of proficiency, which originally was a level 2 of 5) did not go into effect for 3rd graders until 2015. This means the first year that Mississippi kids who experienced the “gate” were in the NAEP sample was 2017, when 15 points of our 20-point gain had already happened. In math, 11 points of the 18-point gain happened between 2003-2015 in slow, steady increments as I note above. What this means is that for good or for ill, the LBPA can only explain 4th grade gains beginning in 2017.
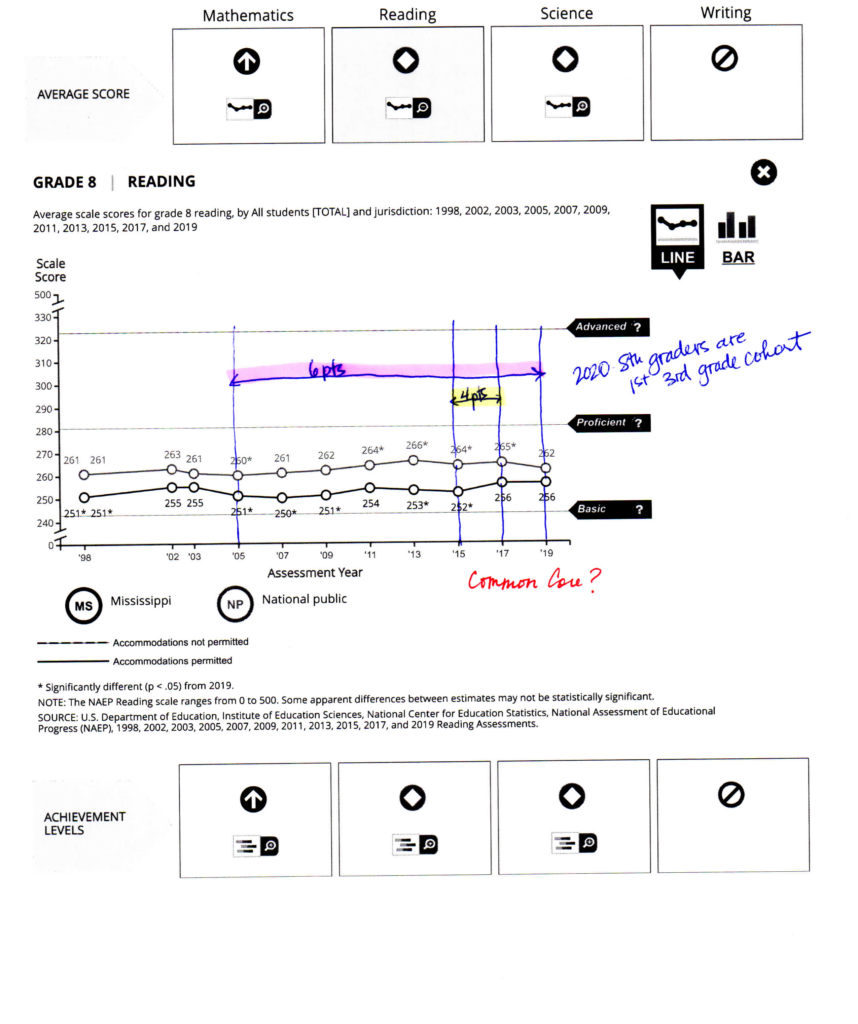
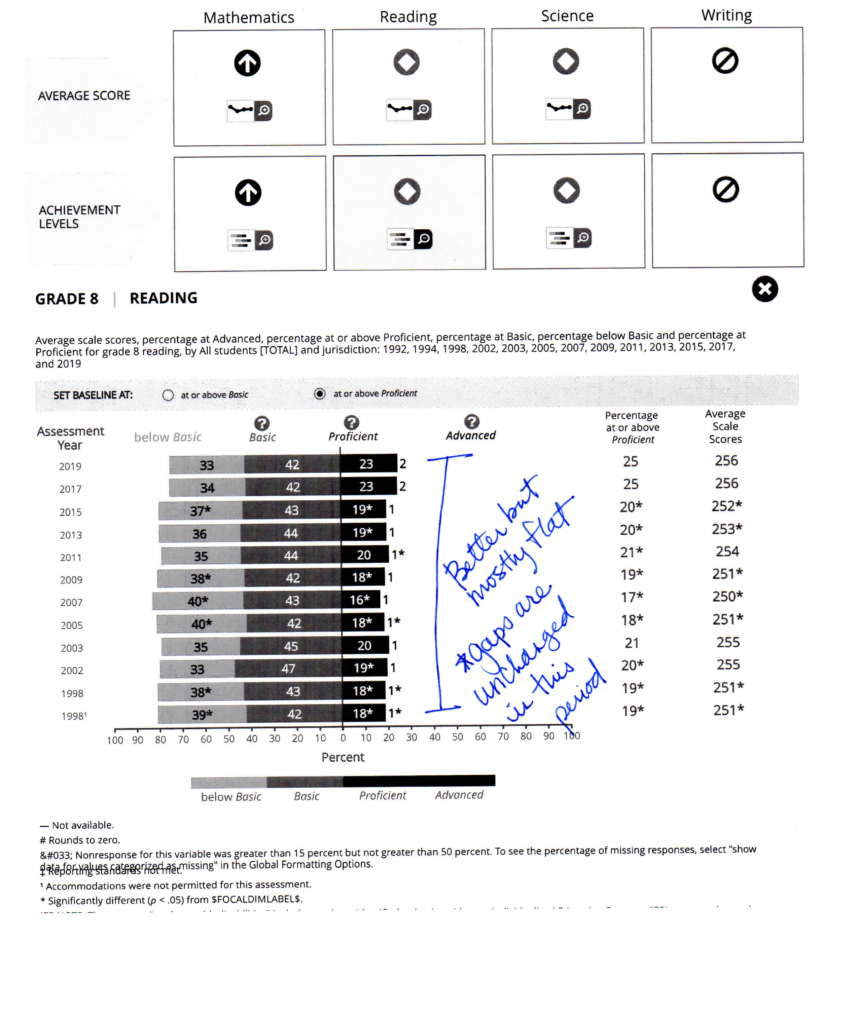
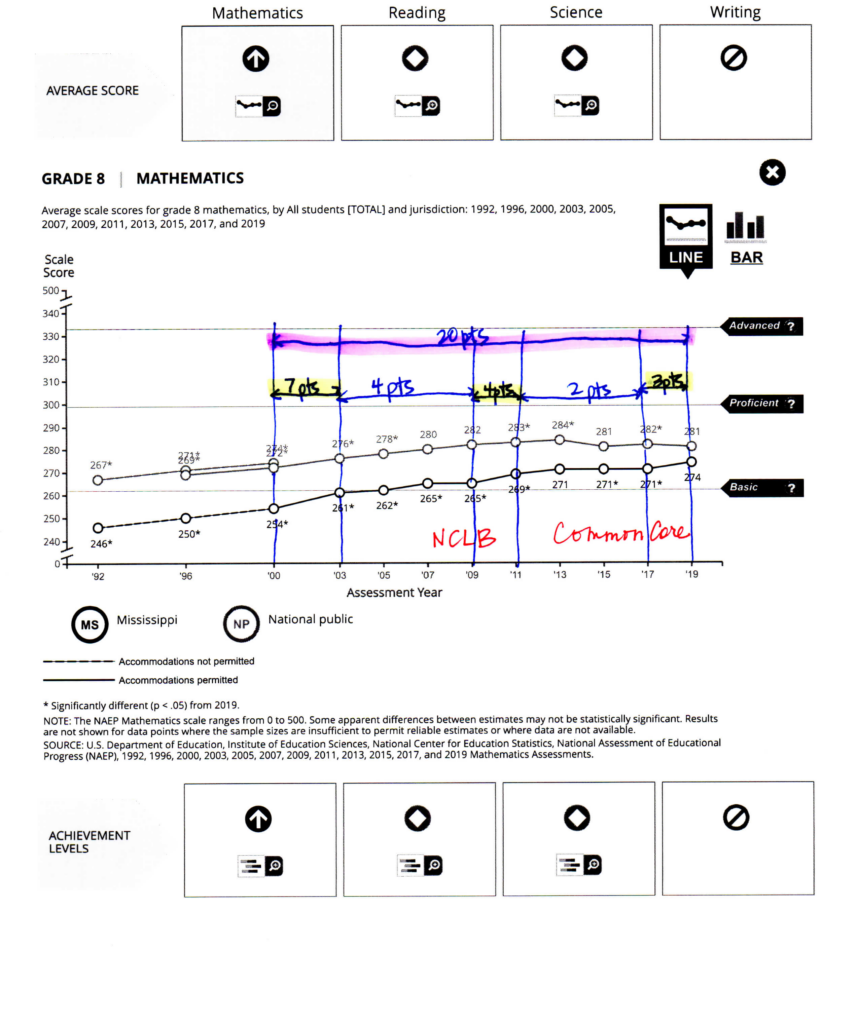
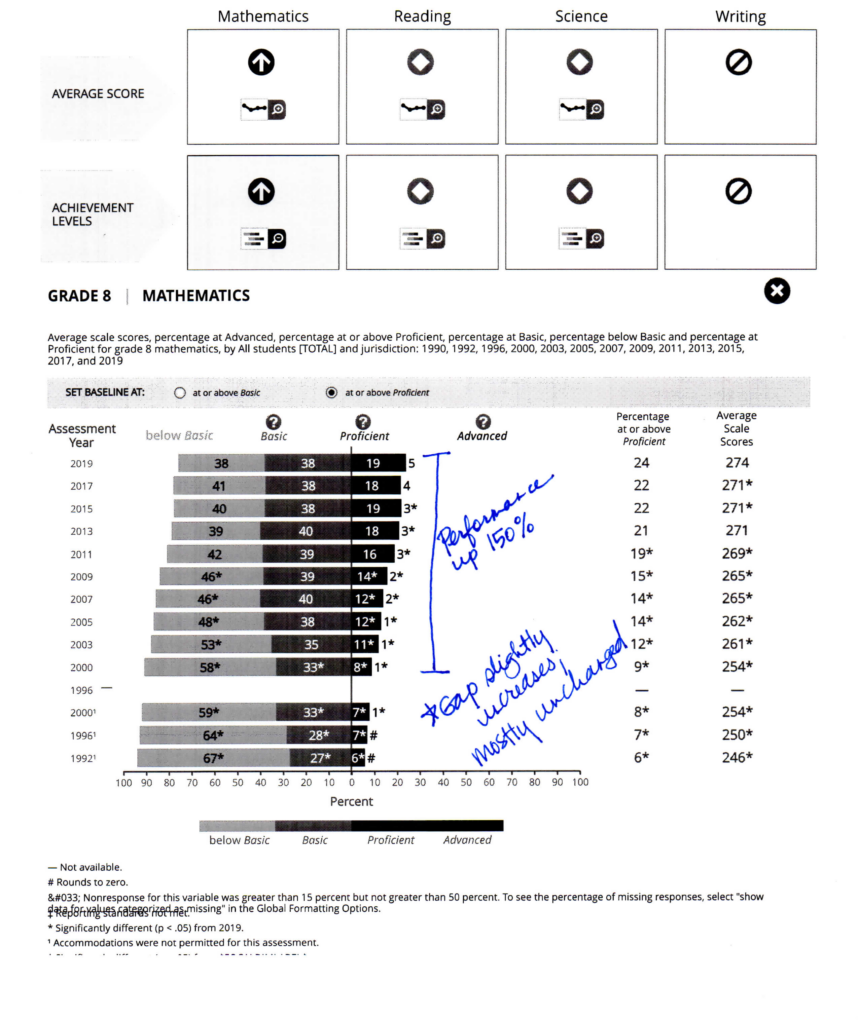
For further context, we should also look at 8th grade data in this same period. Mississippi students’ scores in both reading and math improved at 8th grade over the last 20 years, despite the national data being mostly flat. Our students’ math data, again, showed very steady improvement that actually exceeds the improvement in reading data, though reading scores also improved overall and relative to the national numbers. None of this can be explained by the LBPA. The first cohort of 3rd graders affected by the gate would have been 8th graders in 2020(!).
What is the “Bottom 10%” Argument, and Why Is It Unpersuasive?
The LA Times column claims that Mississippi’s NAEP success—specifically our reaching the national average in 4th grade reading—is a sham based on the analysis of a blogger armed with a graph of NAEP 4th grade reading data between 2013 and 2022 and the claim that Mississippi had a “nearly 10%” retention rate in 3rd grade following the LBPA’s passage. Upon reading the blogger’s “analysis,” one will find that he “added back in” the would-be scores of Mississippi’s would-be 4th graders who, but for the LBPA he alleges, would have been in the NAEP sample. It’s a little fuzzy exactly how he does this, as his graph only shows a line for the results of “adding back [the] bottom 10%” and said that the result lowers the score average enough that Mississippi had no “real” gains at all between 2013 and 2022.
Astute readers who reviewed the above section about what Mississippi’s NAEP data and the LBPA will immediately notice that the first problem is that the timelines do not align. At best, if the 10% argument has any merit, it only explains the reading gains between 2015 and 2019.2 These gains were certainly important and statistically significant, but they were not the majority of the improvement, nor were they unusual for the pattern of improvement we have seen in our reading data over a 20-year period. Also, Mississippi experienced a single-point change (not statistically significant!) between 2015 and 2017 when the first “10%” would have allegedly been disappeared from the sample. Would this gain not be much larger if the 10% theory holds? The best argument in favor of the 10% theory is actually the 2017-2019 jump in 4th grade math since, previously, those gains had been so slow. Unfortunately, one would have to make a lot more assumptions about the role of reading on the math test as well as surmise retained students are even worse at math to make this make sense. Furthermore, one would also have neglect to make these assumptions for Mississippi students not promoted after 2018 since there was, again, only a single-point increase in math between 2015 and 2017 and it was not statistically significant. If this is beginning to seem a little suspect, well…it just gets more suspect!
I do not know where these esteemed gentlemen got the 10% figure for every year in this period (did they round up from the 2022 overall rate and just assume the rate has been constant?), but the percentage of 3rd graders held back as a result of the LBPA in whole or in part has never been that high. Certainly, the LBPA caused an increase of between 5.74-5.91 percentage points in the retention rate over a base trend of around 3-3.4% in the years immediately prior to the 2014-2015 implementation, but after that first year, the retention rate began to drop back down to pre-LBPA levels. By 2017-2018, the retention rate as a result of the LBPA was no higher than 1.58%, and the overall rate was less than 5%.3 As a result, of Mississippi 4th graders taking NAEP in 2019, the blogger fellow can only “add back in” 1.58% (or at most “less than 5%,” according to MDE) using the his undisclosed “add back” methodology, if he has any intentions of being honest.
Because the LBPA caused so few retentions by 2018, Mississippi actually raised the bar in 2018-2019 so that “passing” the gate meant a higher level of proficiency in reading (now a 3 of 5, instead of a 2 of 5). After that, the overall retention rate did reach a high of 9.6% for the 2019 3rd grade cohort (2020’s 4th grade cohort), but those kids weren’t in the 2019 or 2022 4th grade NAEP. The students in the 2022 4th grade NAEP sample did not face the gate, as these children were 3rd graders in 2021 when Mississippi tested but did not count the tests for accountability purposes as a result of the pandemic.
I want to pause here to say that I object to the whole construct of the bottom 10% methodology because retained students don’t just disappear such that one needs to “add them back in.” They actually eventually get promoted, which means they do show up in 4th grade data, including 4th grade NAEP, just after some remediation (hopefully!). Having better scores after being held back…is that not the point of grade retention?
So Is the Miracle Real or Not? (Spoiler: The Gains Are Real.)
If the mis-NAEPery of the blogger/LA Times guys doesn’t explain anything, what was happening in Mississippi during this time to explain this “miracle” of kids from “[insert insulting adjective from the LA Times piece]4 Mississippi”? Our people were not getting a lot richer nor did Mississippi outspend other states, and as Mr. LA Times notes, we do not have very generous or progressive social policies. (I would welcome an analysis from a poverty researcher on economic conditions here since 2003 vis-a-vis the nation.)
In my humble opinion as a person who might just be an expert on education policy in Mississippi, there’s actually a much less sexy explanation than either a single-policy “miracle” or a sham but one which has the most coherence considering all the information: the effects of No Child Left Behind, the nationally aligned Mississippi College and Career Readiness Standards, and a comprehensive approach to improving education since 2012. There is at least one study about the fact that NCLB led to achievement gains nationally, including in Mississippi. We’ll surely see similar studies about the second wave of the standards movement beginning in 2008 at some point in the future. My annotated notes above mark when each of these policies went into effect as well as other important changes. Long story short, I think there are very good reasons to believe that the long, upward trajectory of Mississippi in reading and math at BOTH 4th and 8th grade is due to a long-term commitment to increasing state standards and aligning state testing and accountability systems. The reading work that has become such a sexy national story is great! phenomenal! ground-breaking!—and also part of a raft of policies that changed in this time and likely contributed to success. Does that mean that other states should not try to emulate the reading work? No, it absolutely should be studied and replicated. However, as I’ve repeatedly told anyone who would listen in the last three years, one has to look at everything we did in context. The gains are real, and I would welcome any credible researcher do a serious, careful study of our NAEP data and our context to try to explain them better than I have here.
One final note: I don’t generally have the time (or the desire) to write these kinds of pieces because I have other, more important things to do for children in Mississippi than entertain half-baked analyses and hit pieces. Mississippi’s education improvements over the last two decades are a bright spot for our state. For those who would discredit them without doing adequate homework, maybe y’all should take some time to examine your biases, namely why it is just so impossible for you to believe that kids in Mississippi public schools, over half of whom are kids of color, have reached the national average after literal years of hard work from people who care about them. For everyone else, stay safe out there.
__
1 There’s a strange 12-point jump between 2000 and 2003, both in Mississippi and nationally, that a NAEP researcher could probably better explain but that data is outside of the scope discussed here.
2 The pandemic made both the 2022 administration of the assessment and the resulting data unusual, and since we saw no statistical change from 2019, I have focused on the story up to 2019.
3 Grace Breazeale on our team pulled the LBPA passage reports for every year of implementation from MDE’s website. These reports show the number of students who passed after the initial test and also after the re-test(s) as well as all the students who qualified for promotion anyway under a good cause exemption. MDE further provides official retention rate data for every grade K-8. She also pulled retention data from prior years from the US Department of Education’s OCR data set as well as MDE’s official enrollment by grade in those years. There is some nuance with these data, so if anyone has questions, we can answer them. See our calculations here.
4 This is purposeful snark. He called Mississippi a lot of nasty names.

Dear Ms. Cantor,
Thank you for writing such a meaningful piece in response to the “naysayers” who lack understanding. I enjoyed your approach.
As a retired teacher/school administrator and service on two districk school boards in Alabama, I now focus on education issues, primarily Alabama’a dismal reading progress in the primary grades.
Alabama uses a statewide reading assessment called Alabama Comprehensive Achievement Program – purchased from a national education corporation, particularly to use for assessments. Of course, it’s called our state’s achievement. Our schools have been a dismal failure in 3rd and 4th grade reading, especially in 4th-grade reading. Question for you: What “outside” company does Mississippi use? Thank you.
Hi Dr. Nichols,
Thank you for your comment. Mississippi currently has a contract with Questar to administer statewide assessments for students in 3rd grade – 8th grade (in addition to Algebra I and English II EOCs for high school students).
-Grace Breazeale
K-12 Policy Associate